


-39%


Chart Osmosis
Original price was: KSh 1,106.00.KSh 680.00Current price is: KSh 680.00.
Size 55 x 90 cm.
Available in English & Hindi.
Multicolour printing on 80 GSM map litho paper.
Thermally Laminated with 30 micron thick best quality polyester film on both sides.
Fitted with best quality plastic rollers at the top
- Description
- Reviews (0)
Description
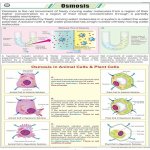
Chart Osmosis
This chart will illustrate the process of osmosis and its biological significance.
Layout:
The chart can be a segmented diagram with arrows showing the movement of water molecules.
Sections:
- Solutions:
- Show two containers, labeled “Solution A” and “Solution B,” representing different concentrations of a solute (dissolved substance) in a solvent (usually water).
- Solution A: Label it as “Low Concentration” (hypotonic solution) and depict it with few solute particles dissolved in the solvent (water).
- Solution B: Label it as “High Concentration” (hypertonic solution) and depict it with many solute particles dissolved in the solvent (water).
- Semipermeable Membrane:
- Draw a selectively permeable membrane separating the two solutions.
- Briefly explain that this membrane allows water molecules to pass through but restricts the passage of most solutes.
- Water Movement:
- Show water molecules moving through the semipermeable membrane from the low concentration solution (hypotonic) towards the high concentration solution (hypertonic).
- Arrows should indicate the net movement of water molecules, which is always from low solute concentration to high solute concentration.
Additional Information:
- includes insets depicting scenarios of osmosis in biological contexts:
- Animal Cell: Shows an animal cell in a hypotonic solution. Water enters the cell, causing it to swell. If excessive, this can lead to bursting (cytolysis).
- Plant Cell: Shows a plant cell in a hypertonic solution. Water moves out of the cell, causing it to shrink (plasmolysis). The cell wall in plants helps prevent excessive shrinking and bursting.
- Osmosis in Plants: Briefly mentions the role of osmosis in plant functions like turgor pressure (supporting plant structure) and water uptake through roots.
Benefits:
This visual chart aids in understanding osmosis by showcasing the movement of water molecules driven by concentration differences. The inset scenarios highlight the real-world applications of osmosis in biological systems.


Reviews
There are no reviews yet.